downloadGroupGroupnoun_press release_995423_000000 copyGroupnoun_Feed_96767_000000Group 19noun_pictures_1817522_000000Member company iconResource item iconStore item iconGroup 19Group 19noun_Photo_2085192_000000 Copynoun_presentation_2096081_000000Group 19Group Copy 7noun_webinar_692730_000000Path
Skip to main content
Default Banner Image

Business and Markets

Electronic EquipmentGlobal electronic equipment production is in its traditional “fall busy season” as the consumer driven end markets ramp up for the holiday season (Chart 1). Both normal seasonality and organic growth are driving this year’s upturn. September 2018 electronic equipment output was up almost 10% over the same month last year. This actual year-over-year growth when overlaid on an autumn seasonal upturn is providing a nice end of year finish. Source: Custer Consulting Group based on regional data American Electronic Supply ChainChart 2 shows the annualized (12/12) and 3-month (3/12) growth of the U.S./North American supply chain. Aside from the computer sector, all the domestic end markets are expanding driven by defense, electromedical, instruments and control equipment. Total domestic electronic equipment orders were up 8.2% in August 2018 versus August 2017.For components there are clear indications of slowing growth. Printed circuit board orders eased to a +2.7% expansion rate on a 3-month basis and passive component orders contracted 0.2%.The semiconductor industry appears to be coming down from its recent bubble as domestic SEMI capital equipment growth cooled to +3.8% and chip shipments to North America also slowed (to a still respectable) +15% on a 3-month (3/12) basis. Source: Custer Consulting Group based on U.S. Department of Commerce, IPC, SIA/WSTS and SEMI data Geographic ShiftsSemiconductors and semiconductor capital equipment shipments provide good insight into the changing center of gravity of world electronic production.Chart 3 shows semiconductor shipments to each region. This is not regional production but rather consumption -- an indication of regional demand. It effectively measures electronic assembly activity by area. In August over 62% of the world’s chip value was consumed in in Asia/Pacific with another 8.1% used in Japan. Europe consumed 8.5% and North America 21.9%. Chart 4 shows geographical shifts over time for semiconductor capital equipment. Although more volatile month-to-month than semiconductors, the SEMI Capex shift to Asia is obvious. Source: SIA and WSTS Walt Custer of Custer Consulting Group is an analyst focused on the global electronics industry.
Read More
Part 1 of this article discussed the Memory Inventory Cycle Index and compared it with memory device sales and memory fab equipment investments. This article, the second of the two-part series, illustrates how the Memory Inventory Cycle Index starts to weaken before memory sales of the top three memory suppliers decline. It also shows how the Memory Inventory Cycle Index peaked in the fourth quarter of last year along with YoY growth rates for both memory sales and memory fab equipment investments.In addition to the weakening signaled by the Memory Inventory Cycle Index, memory suppliers are facing headwinds in the form of tariffs as mentioned in Micron’s most recent earnings call. The U.S.-China trade dispute could reduce Micron’s profitability; China granted a preliminary injunction to prevent Micron’s Chinese subsidiary from manufacturing and selling in China this July. However, it is very difficult to quantify the risk the tariffs pose to the future of the memory market.On the other hand, the YoY growth rate of semiconductor sales according to the World Semiconductor Trade Statistics is closely tied to China’s manufacturing sector as shown by the Purchasing Managers Index (PMI) New export orders and Orders in hand sub-indexes. Figure 3 shows that as the growth rate of new exports and order backlog slows, the YoY growth rate of semiconductor sales will be adversely impacted. As the largest consumer of semiconductors in the world, China will bear the brunt of the slowing market. Figure 3. Memory Inventory Cycle Index China manufacturing sector PMI’s sub-indices * RemarksChina PMI’s sub-indices are on the basis of the data published by NBS (National Bureau of Satistics of China). Also those data were calculated based on 12MMA (12-month moving average) to minimize seasonal fluctuation. The YoY growth rate of the 3-month moving average of semiconductor sales in China alone, China and Asia Pacific, and all regions showed additional declines in July (Figure 4). Monitoring the Orders in hand and New export orders sub-indices for China and China’s semiconductor consumption and WSTS sales revenue in China can help track the risk of trade disputes. Figure 4. YoY growth rate of semiconductor sales revenue in China and Asia Pacific * Remarks1) Regions as defined by WSTS’ Bluebook.2) Sales revenue were calculated based on 3MMA (3-month moving average value). A review of the relationship between the Memory Inventory Cycle Index, semiconductor sales, and memory fab equipment investment growth rates suggests we have passed the peak in the current cycle. However, bear in mind that the Work In Process (WIP) to Finished-goods inventory ratio has sharply increased since 2017 as shown in Figure 5. The increase in WIP inventory could be attributed to the increasing technical challenges associated with 3D NAND stacking and DRAM scaling. As a result, the proportion of finished-goods inventory in total inventory remained low until the second quarter of 2018, possibly implying that memory demand remained healthy in spite of the contraction modeled by the Memory Inventory Cycle Index. Figure 5. The proportion of finished-goods inventory in the total inventories * Remarks 1) All inventories data from 3 companies’ financial reports were calculated based on 4-quarter moving average.2) Total Inventory accounts for the sum of Finished-Goods, WIP, and Raw materials inventory.3) Company data complied by SEMI. The Memory Inventory Cycle Index has entered a period of contraction, which is supported by Micron’s weak guidance for its fiscal first quarter of 2019 (September to November). The outlook for memory sales and memory fab equipment investments reported by WSTS and SEMI, respectively, also suggests that a market correction is underway. While the low proportion of finished-goods inventory does not threaten the market yet, it should remind industry observers to view high WIP inventories with caution. Unlike past inventory cycles, the high inventory levels could burden the memory market in the absence of sustainable demand.Sungho Yoon is a senior market research analyst in Industry Research and Statistics at SEMI. SEMI China IC Ecosystem ReportLearn more about 30 new fab construction projects underway or planned in China in the newly released SEMI China IC Ecosystem Report. The research report is a comprehensive update and analysis of China's IC manufacturing ecosystem with charts, graphs, tables and maps.
Read More
Micron, one of the top three memory semiconductor companies, reported solid results for the fourth quarter of fiscal 2018 (June to August) to extend a multi-quarter string of strong growth. However, the company’s mediocre guidance for the current quarter has raised concerns that memory demand will start to slow.To shed light on this super memory cycle, which began in the second half of 2016, this article examines correlations among the top three memory suppliers’ sales revenue, quarterly inventory levels, World Semiconductor Trade Statistics (WSTS) market data, and memory fab equipment investments reported by SEMI.The Memory Inventory Cycle Index, which is based on financial data reported by Samsung, SK Hynix and Micron, is the difference between the year-over-year growth rates of sales (or shipments) and inventories. The index explains business cycle fluctuations such as expansions and contractions, trending up in expansions and declining in contractions. Figure 1 shows both historical Micron sales (blue dotted line) and the quarterly Memory Inventory Cycle Index (black solid line). To minimize seasonal fluctuations, both were calculated based on a four-quarter moving average of sales and inventories. Figure 1. Memory Inventory Cycle Index Compared to Memory Sales* Remarks1) Memory Inventory Cycle Index = YoY growth rate of memory sales revenues - YoY growth rate of memory total inventoris value on a four quarters moving average.2) Calculated memory sales and inventoris are based on Samsung, SK Hynix, and Micron public announcements.3) South Korea Won were converted to US$ based on the quaterly average value released by FRED.4) Companies’ sales data were calculated based on 4-quarter moving average.5) Company data complied by SEMI. As shown in Figure 1, the Memory Inventory Cycle Index has been declining since peaking in the fourth quarter of 2017, mirroring the previous two contractions – in 2010 and 2014 – in which memory sales slowed or stagnated after four quarters of the index decline. Accordingly, if this relationship holds between the Memory Inventory Cycle Index and sales, Micron’s sales will slow in the coming quarters and is consistent with Micron’s guidance for the current quarter. Moreover, the index suggests that the sum of three companies’ sales (the solid red line) will exhibit a similar trend of decreased growth in the coming quarters, which will impact the annual growth rate of global memory sales.WSTS recently increased its 2018 forecast for memory sales to 30.5%, up from 26.5% projected in June of this year. However, the 3-month moving average of memory sales shows that memory sales already increased by 48% YoY in the first half of the year, which means growth is expected to be lower in the second half of the year. Other signs pointing to a weaker end to the year include front-end equipment investments by the top three memory suppliers. SEMI is modeling an annual increase of only one percent for the year for these suppliers, with spending down 23% in the second half relative to the first half of the year.Figure 2 shows the historical trend of the Memory Inventory Cycle Index, the YoY growth rate of memory sales, and YoY memory fab equipment investments. The Memory Inventory Cycle Index increased faster than memory sales and fab equipment investments in the past two cycles. In the most recent memory cycle, these three indexes are moving in tandem, each peaking in the fourth quarter of 2017. Figure 2. Memory Inventory Cycle Index, Memory Sales and Memory Fab Equipment Investments* Remarks1) Both sales and memory fab equipment investments data were calculated based on 4-quarter moving average to minimize seasonal fluctuation.2) All data are from SEMI, except memory sales (WSTS) While overall memory sales continue to be strong this year, memory ASPs have shown signs of weakening right after the inventory index peak. NAND flash ASPs have been trending downward since the first quarter of 2018. With the recent inventory correction and short-term CPU shortage, DRAM ASPs are expected to soften in the fourth quarter of 2018. The looming memory market slowdown has memory makers adjusting their capacity expansion plans for the rest of this year. Some new capacity additions, especially for DRAM, have been pushed out to 2019. The memory inventory cycle index has to some extent foretold the slowdown of the memory market. In the second and final part of this article, we will discuss the correlation between the Memory Inventory Cycle Index and China’s semiconductor sales and Purchasing Managers Index. We will also look at the increasing level of memory inventory in the past few quarters and its composition including Work-in-Progress and Finished goods. Clark Tseng is director and Sungho Yoon is senior market research analyst in Industry Research and Statistics at SEMI. SEMI World Fab ForecastFor the latest worldwide memory fabs forecast including company details, please see the SEMI World Fab Forecast. The report includes quarter-to-quarter fab data from planning to production for both DRAM and NAND Flash companies.
Read More
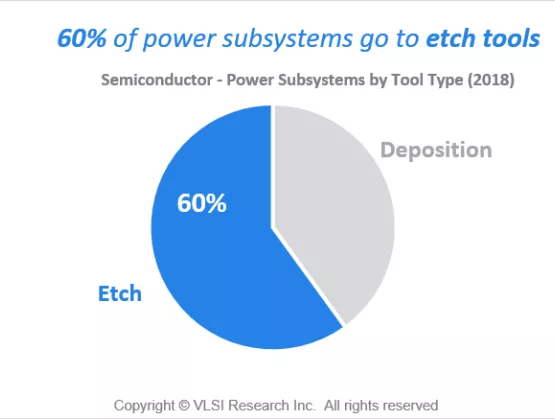
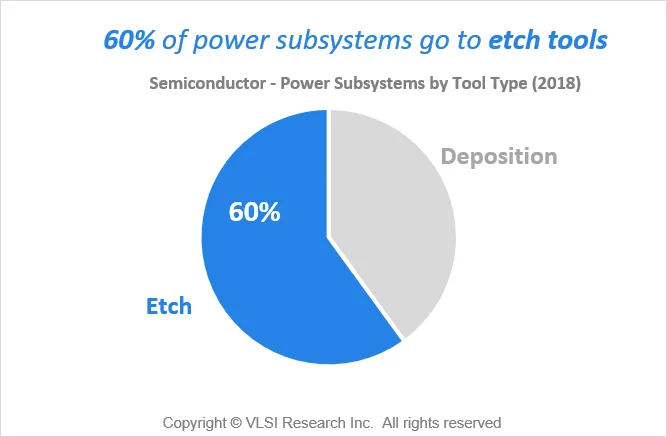
Process power and reactive gas subsystems for semiconductor manufacturing equipment have grown at a CAGR of 21% since 2013. The segment growth is considerably above the critical subsystems industry average of 9.5% and is attributable to higher demand for vacuum processing equipment over the period.Process power and reactive gas subsystems now account for approximately 12% of all expenditures on critical subsystems used on semiconductor manufacturing equipment, up from 7% in 2013. The main driver of this exceptional growth has been the rise in vacuum processing steps (deposition and etch) during the manufacturing processes of both logic and memory devices. Most deposition and etch processes require an RF generator to provide a plasma energy source in the chamber, increasing demand for tools with power subsystems such as RF power supplies and matching networks.Multiple patterning and the advent of 3D NAND in high-volume manufacturing have significantly increased the number of deposition and etch processing steps and, in the case of 3D NAND, longer and more difficult etch processes are requiring a wider range of power solutions. Further analysis shows that 3D NAND has been the principle growth catalyst, with the total share of power subsystems going to memory applications increasing 8 percentage points since 2013. Memory applications now account for almost half of all power subsystems demand in 2018. Interestingly, investigation of power subsystems by tool type reveals that a clear majority of power subsystems (60%) find their way on to etch tools with only 40% on deposition tools. This can be explained by the fact that more delicate etch processes can require multiple RF power solutions per tool, whereas deposition does always use plasma energy sources, for example in thermal deposition processes.Despite the staggering growth performance of the power subsystems segment over the past five years, we expect the growth rate to moderate significantly in the run-up to 2023. Now that 3D NAND has been adopted in high-volume manufacturing, we expect the rate of increase in vacuum/plasma processing steps to slow down. The introduction of EUV also has the potential to taper demand for vacuum processing equipment. However, it is not expected the reverse the trend as multiple patterning techniques will still be needed in conjunction with EUV to achieve the desired improvements in device density and performance. The future growth trend for power and reactive gas subsystems is forecast to be in line with the critical subsystems industry average at approximately 2.0% CAGR until 2023.For more information about Critical Subsystems and VLSI Research, please visit www.vlsiresearch.com/public/csubsJulian West is a technical and market analyst at VLSI Research Europe.
Read More
Outsourced Semiconductor Assembly and Test (OSAT) service providers experienced strong growth in 2017, but will this growth continue? In the last few years, OSAT growth has been driven by shipments for packages found in smartphones, but this market is slowing. What will replace it? Growth in power devices is strong and electronic content in vehicles is increasing. Will OSATs participate in this growth? Many OSATs have plants dedicated to automotive package assembly and will see continued growth. Growing demand for connectivity everywhere, called IoT, is generating large amounts of data, creating the need for more servers and datacenters. The adoption of Artificial Intelligence (AI) across a broad range of applications is driving demand for high-performance packages, but will this assembly take place at the OSATs or foundries? In the third and fourth quarters of 2017, growth in cryptocurrency provided unanticipated revenue for a number of OSATs. Given that the most well-known crypto mining companies and the biggest mining pools are all based in China, several OSATs, including major Taiwanese and Chinese service providers, experienced revenue growth in 2017 directly attributed to the assembly of ASICs in flip chip scale packages (FC-CSPs) and GPUs in flip chip ball grid arrays (FC-BGAs) for the cryptocurrency market. However, the first and second quarter of this year has seen decreased demand for GPUs and ASICs for this application. The assembly of packages for cryptocurrency slowed considerably in the first half of the year and therefore can’t be counted on to add as much to the revenue base as in the previous year. Going into the latter half of the year, the demand for Crypto ASICs is expected to pick up as new generation of 7nm chips will drive new investment and replacement cycle while crypto-mining GPU will see a further decline. Three of the top 10 OSATs, Jiangsu Changjiang Electronics Technology (JCET), Tianshui Huatian Technology (Huatian), and Tongfu Microelectronics (TFME), are based in China. China’s share of the top 10 OSATs’ revenue increased from slightly less than 23 percent in 2016 to more than 25 percent in 2017, and this trend is expected to continue. Crypto-related packaging and test business has certainly contributed a big portion of the share gain. Major OSATs such as TFME and Tianshui Huatian plan expansion in their plants and they expect to fill this added capacity in a broad range of packages. Huatian’s new Nanjing plant will include assembly for memory packages. TFME plans to set up a plant in Xiamen, Fujian Province to provide bumping, wafer level packaging, and system-in-packaging (SiP) services. Tracking the capabilities of OSATs is increasingly important. SEMI and TechSearch International have introduced a new Worldwide OSAT Manufacturing Site Database that provides listings of OSAT facility locations and package and test options in each factory. This database indicates the specific packages offered at each location. Finding plants that offer automotive qualified assembly is also possible with the database. Companies that offer bumping and wafer level packaging are identified. Over 120 companies and 300 facilities are tracked in this database covering both OSAT packaging and test facilities. For additional information about this informative database, please visit https://discover.semi.org/osat-database-registration.html E. Jan Vardaman is president of TechSearch International, Inc., and Clark Tseng is director of Industry Research and Statistics at SEMI.
Read More
SEMI FabView update for calendar year Q3 2018 Global fab construction investment shows continuing strength, with 19 new fab projects expected to begin construction in 2019 and 2020, based on the latest data published in SEMI’s World Fab Forecast. Fab investment is just one indicator of how growing demand in areas such as high-performance computing, data storage, artificial intelligence (AI), cloud computing, and automotive are driving the fourth consecutive year of spending growth in the semiconductor industry. Below are a few highlights* from September’s SEMI FabView: Memory: Not fading Micron plans to invest $3 billion by 2030 in Manassas, Virginia – These investments, driven by strong demand for automotive applications, are contemplated in Micron's long-term model. The production ramp is anticipated to be in the first half of 2020. SK Hynix to build new DRAM fab in Icheon (Gyeonggi Province), Korea – The construction, to be completed by the end of 2020, will adopt 1znm node (probably EUV). Total investment is estimated to exceed $13 billion. Nanya Technology doubles 2018 capex plan – The increase is for additional DRAM capacity and more 20nm DRAM conversion (from 30nm). 200mm and below: Not leading edge, but continues to draw investment Vanguard changes fab investment strategy – Vanguard will focus on 200 mm and has scrapped its plan for 300mm expansion. Murata to invest into 150mm expansion – Murata announced a 5 billion Yen investment (US$44.6 million) in a new fab extension in Vantaa, Finland. Investment, M A in Analog, Logic, Power and Opto Segments Texas Instruments is looking to invest $3.2 billion in new fab construction in 2019 – Texas Instruments is eyeing Richardson, Texas and also considering sites outside Texas. Bosch 300mm fab in Dresden, Germany – Bosch held a groundbreaking ceremony on April 24. Equipment installation is expected in 2H19. Microchip completes acquisition of Microsemi – Microchip closed its $8.45 billion acquisition of Microsemi on May 29. Microsemi has five fabs in the U.S. with a wide range of semiconductor products and system solutions. New fabs in China keep on coming Shanghai Jita Semiconductor/Huada Semiconductor – Shanghai Jita Semiconductor, a subsidiary of Huada Semiconductor and China Electronics Corporation (CEC), announced plans earlier this month to build both 200 mm and 300 mm semiconductor fabs for analog and power semiconductors in Shanghai. The combined fab investment will total $5.18 billion. Hamamatsu Photonics building 200 mm fab – Hamamatsu announced that it is building a new facility Investment of 2.8 billion Yen (US$25 million) to boost opto semiconductor capacity. Production is anticipated to start in late 2019. * Actual FabView updates provide more detail SEMI FabView, a mobile-friendly, interactive version of SEMI’s popular World Fab Forecast, delivers on-demand fab information such as fab spending and capacity for over 1,200 facilities, including over 60 planned facilities worldwide, across a wide range of product segments including Power, GPU, Memory, Foundry, MEMS and Sensors fabs. Fab data include region, start of construction, operation, construction and equipment spending, capacity, wafer sizes, product types and geometries. SEMI FabView subscribers receive forecast model updates through SEMI’s World Fab Database. Click here for a trial if you want to experience SEMI FabView first hand. Christian G. Dieseldorff is senior principal analyst and Eugenia Liu is senior product marketing manager, Industry Research and Statistics, SEMI, Milpitas, California.

Read More
SEMI Releases latest update to World Fab Forecast with adjusted semiconductor revenue consensus for second-half 2018 and 2019 Global semiconductor revenue in 2018 is now expected to reach $473.8 billion and clock a growth rate of 15 percent, a significant upward revision from the 7.5 percent expansion (to $442.9 billion) forecast at the start of the year by six research and investment forecasts tracked by SEMI Industry Research and Statistics (SEMI IR S). Data center growth will remain robust in the coming quarters, fueling demand for memory devices. In addition, cloud computing will continue to spur strong CPU, GPU, networking, ASIC, and DRAM and NAND demand through 2019, driving a consensus 3.63 percent year-to-year growth to reach the semiconductor revenue of $491 billion in 2019. Fab equipment spending (new and used) for 2018 is expected to increase by 14 percent to a record high of $63 billion, according to the last data from the SEMI World Fab Forecast, published by SEMI IR S. For 2019, fab equipment spending (new and used) is expected to increase 8 percent to another record of just under $68 billion. Memory continues to be the biggest swing factor in fab spending in 2018 and is expected to lead growth into 2020. 3D NAND will see the most capacity added in 2018 and 2019 with growth of 41 percent in 2018 and 27 percent in 2019, according to the SEMI World Fab Forecast. DRAM investment will see even stronger growth in 2018 and 2019 driven by new capacity addition as well as the continued technology shrink towards 1y/1z nm. For the first half of 2018, global spending for semiconductor fab equipment continues its growth momentum from 2017. Though we expect some softness in the second half of 2018, the outlook for 2019 remains robust with a fourth consecutive year of growth – the first such run since the 1990s. This prolonged growth cycle has been propelled by memory and will be extended by significant investment in China in 2019. Although a potential slowdown in 2020 is a concern, the overall outlook for semiconductor demand remains solid due to broad-based growth trends in data center, artificial intelligence (AI)/machine learning (ML), automotive, and industrial segments. Following are other SEMI forecasts for fab spending. Installed Capacity 3D NAND will see the most capacity added in both 2018 and 2019 with growth of 41 percent in 2018 and 27 percent in 2019. Foundry capacity growth is steady at 3 percent in 2018 and 6 percent in 2019, driven by both leading-edge and trailing-edge capacity buildup. 200mm fab capacity will increase 4 percent in 2018 and 3 percent in 2019, fueled by demand for MCU, sensors, PMIC, MOSFET and Driver IC. New Facilities / Construction Spending In 2018, there are 72 construction projects with investments totaling $15 billion, a year-over-year increase of 23 percent. Construction spending will reach all-time highs with China continuing its lead at US$7 billion in 2018, shattering its own record of $6.3 billion investment in 2017. Most construction spending in 2018 will be for Memory (just under $9 billion), primarily for 3D NAND followed by DRAM. Foundry will log second place in construction spending at just under $5 billion. Fab Equipment Spending Fab equipment spending (new and used) for 2018 is expected to jump 14 percent to a record high of US$63 billion, flat from the forecast issued in June 2018. Equipment spending (new and used) for 2019 is expected to increase 8 percent to another record of just under US$68 billion, a downward adjustment from +9 percent published in June 2018. We believe equipment spending will remain healthy, driven by solid, broad-based demand and predictable technology investments on top of constructive SEMICAP equipment fundamentals. Activity Report The August report features 1,265 records including about 300 Opto- and LED-related facilities. We have made 223 changes related to 216 fabs/lines. The modifications include the addition of new records, changes to existing records, the deletion of records since the February 2018 World Fab Forecast report. We are tracking 103 future facilities/lines with various probabilities that will start volume production in 2018 or later. Download a sample report Not a subscriber? Please review SEMI fab databases listed below. Our databases deliver the latest forecast and a complete analysis of front-end fabs and foundries worldwide. They are ideal resources to empower your market research. Eugenia Liu is a Senior Product Marketing Manager at SEMI.
Read More
The China IC Ecosystem Report, a comprehensive report for the IC manufacturing supply chain, reveals that front-end fab capacity in China will grow to account for 16 percent of the world's semiconductor fab capacity this year, a share that will increase to 20 percent by the end of 2020. With the rapid growth, China will top the rest of the world in fab investment in 2020 with more than $20 billion in spending, driven by memory and foundry projects funded by both multinational and domestic companies, according to the new report released today by SEMI.The report also shows that IC Design remained the largest semiconductor sector in China for the second year in a row with $31.9 billion in revenue in 2017, widening its lead over the long-dominant IC Packaging and Test sector. The ascent of China’s IC Design sector comes as the region’s equipment market is expected to claim the top spot in 2020 for the first time on the strength of the continuing development of its domestic manufacturing capability. China’s maturing domestic fab sector is also benefiting domestic equipment and materials suppliers. Both groups continue to see gains in their product offerings and capabilities, particularly in silicon wafer production. The China IC Ecosystem Report is produced by SEMI, the global industry association and provider of independent electronics market research.The more than RMB140 billion (US$21.5 billion) accumulated by the National IC Fund, a critical component of the 2014 National Guideline to address China’s semiconductor trade deficit, has spurred rapid gains throughout the region’s IC supply chain. Semiconductors are China’s largest import by revenue. Phase 2 of funding aims to raise another RMB150-200 billion ($23.0-$30.0 billion).Encouraged by the National Guideline and favorable policies, skilled overseas talent is returning to China, triggering an explosion of domestic IC Design start-ups that are benefiting from access to investment and favorable policies, the report shows.Other highlights from The China IC Ecosystem Report include: Currently 25 new fab construction projects are underway or planned in China. 17 - 300 mm fabs are being tracked as part of this investment and expansion activity. Foundry, DRAM and 3D NAND are the leading segments for fab investment and new capacity in China. China’s IC Packaging and Test industry is also moving up the value chain by enhancing its technology offerings through mergers and acquisitions and building advanced capabilities to entice international integrated device manufacturers. China’s IC materials market, currently dominated by Packaging materials, became the second largest regional market for materials in 2016, a position it solidified in 2017. China’s materials market is expected to grow at a 10 percent CAGR from 2015 to 2019, driven primarily by the region’s new fab capacity ramp in the coming years. Fab capacity will expand at a 14 percent CAGR during that period. The China IC Ecosystem Report covers the latest semiconductor supply chain and market developments including the rise of China’s IC industry, national and local government policies, public and private funding, and their implications for China's IC supply chain. The report also compares key domestic companies and their international peers segment by segment. To learn more and get a sample of the report, visit http://semi.huihuidehui.workers.dev/en/china-ic-ecosystem-report.Eugenia is a Senior Product Marketing Manager at SEMI.
Read More
2Q’18 Electronic Supply Chain Growth Update Chart 1 is a preliminary estimate of global growth of the electronic supply chain by sector for 2Q’18 vs 2Q’17. Note the strong performance of semiconductors, SEMI capital equipment and passive components. Chart 2 gives preliminary 2Q’18 world electronic equipment growth by type. Global electronic equipment sales rose an estimated 9%+ when consolidated into US dollars in the second quarter of this year compared to the same quarter in 2017. Based on this, data global electronic equipment sales growth appears to have now peaked on a 3/12 growth basis for this present business cycle (Chart 3). As a caution these charts are based on a combination of actual company financial reports and estimates for companies that have not yet reported their calendar second quarter financial results. A number of large companies have yet to report but these early estimates have historically been close to final growth values. We will update Chart 1 next month.Semiconductor Capital Equipment Business Cycle Semiconductor capital equipment sales are historically very volatile, with their growth fluctuating MUCH MORE than electronic equipment (Chart 4). However, both series appear to have peaked on a 3/12 basis for this current cycle. Semiconductors, SEMI capital equipment and Taiwan chip foundry sales all are seeing slower growth. 3/12 values 1 still indicate an expansion but slower growth is indicated. Supply chain performance in the second half of this year bears careful watching!Walt Custer of Custer Consulting Group is an analyst focused on the global electronics industry.
Read More
Tracking toward even stronger growth than forecast last year, 200mm fabs worldwide are gearing up to add more than 600,000 wafers per month from 2017 through 2022, an 11 percent growth rate that will lead to a new high of 6 million wafers per month by the end of 2022, according to the SEMI Industry Research and Statistics group in its fourth update of the Global 200mm Fab Outlook report. See chart below. All told, 56 older and newer facilities will add capacity, with the MEMS, power, logic and foundry segments contributing the most. To help meet rising demand, new fabs are under construction. Only six facilities plan to reduce capacity. The global 200mm fab count will increase from the 2017 level of the 194 fabs covered in the report to 203 by 2022. See chart. During the five-year forecast period, China, at 44 percent, is expected to account for the greatest growth, followed by Southeast Asia (19 percent), Taiwan (10 percent) and the Americas (8 percent). However, with strong demand for new 200mm fab equipment, the used 200mm fab equipment market has pretty much dried up. What’s more, the availability of key tools and spare parts has become a primary concern for many device makers. These headwinds notwithstanding, many companies remain bullish with plans to add more capacity. The forecast growth of 600,000 wafers per month may ultimately be a conservative estimate. SEMI’s Global 200mm Fab Outlook report lists more than 300 facilities and lines managed by more than 150 companies, providing details on product type, investment, technology and capacity plans by companies and fabs. The fourth update of the Global 200mm Fab Outlook report covers data and predictions from 2011 through the end of 2022, including milestones, detailed investments by quarter, product types, technology nodes and capacities down to fab and project level. Click here for the Global 200mm Fab Outlook Sample Report. Learn more about other SEMI fab databases at semi.huihuidehui.workers.dev/en/MarketInfo/FabDatabase. Christian G. Dieseldorff is director of Industry Research and Statistics, SEMI, Milpitas, California.

Read More